Benchmarking and Rebuilding an Old Web Server - Part 1

Back to Programming
Reviewing my last post I was depressed to see that it had been released almost a year ago. I was so enthusiastic when I started this blog in the beginning of 2025, proud to show off what I had learned and what I had done. Plus by explaining it helped me understand the ideas that I was playing around with. Unfortunately 2025 was a busy year for me and I had to put the programming on hold, both for my own personal goals and in my academic career. With a full work schedule, family of needy cats, and a loving girlfriend with whom I love to spend time, there was little space for me to study for the evening courses in which I was enrolled, let alone personal projects. Sadly I even had to drop out of my evening courses at a local college as I could not find the time to study.
But 2026 is off to a different start. I have left my full time job at the warehouse to pursue a full computer science degree at the local university. This will be an upgrade to the diploma I have in Software Development from a local technical institution, as well as provide me with higher quality education than what I could obtain in evening courses. With some hard work and a bit of luck, I look forward to graduating in a short while with a bachelors in Computer Science with a concentration in Networks and Distributed Systems. I can’t wait!
In some additional good news, this first winter semester is a bit lighter than my future semesters. I will mostly be completing prerequisites for third and fourth year courses. This means I can dedicate some of my time to refreshing my skills and working on some personal projects.
The Problem
Two years ago I worked on a project to help me better learn C and Unix-like operating systems. It was a simple HTTP web server project from Jan Schauman’s incredible course Advanced Programming in the Unix Environment. This project was done in my spare time while I was working, a little here and a little there. The source code for the simple_server can be found on my github page.
As it was for fun, the focus was on learning concepts rather than stressing on completing it for a grade, let alone for production use on the modern internet. However, I always felt what I did could be better.
There are issues of performance in this project. Rather than using the POSIX syscall poll() to handle multiple clients concurrently by multiplexing, it instead uses fork() to create a new child process for every request. This also has the unintended effect of hiding file descriptor leaks as well as any memory leaks. Another thing that bothered me was the fact configurations were made using command line flags where a config file would be better.
The final issue that spurred me to revisit this project is that it failed a mock code review. Following the great advice on Steve Klabnik’s blog post Getting started with Claude for Software Development, I decided to let the large language model perform a code review and it gave some constructive feedback, which can be seen here: Claude code review. I will follow Steve’s advice of using LLM’s to help perform code reviews while I’m learning, but I’ll make a conscious effort to not get stuck in the loop of vibe coding a project. The last thing I want is to let an LLM build something for me, have it explain, and then produce more at my request at a rate beyond what I can understand. That isn’t fun as I wouldn’t be the one steering the ship and I wouldn’t be learning anything. But treating it like a tutor and code reviewer can be helpful.
I want to improve this project. Sure, it isn’t as exciting as working on a kernel module nor as interesting as learning the internals of how a CPU works like the CMU lectures I had watched online, but it would be a great way to refresh my skills in C, as well as to practice developing with an iterative approach to building high grade software.
The Plan
When working on this project I want to make sure that I am not just assuming things are becoming more efficient, or taking Claude’s word as gospel, I want to test the server and see how efficient it is. For this we will use the hey HTTP benchmarking tool for each iteration of the project. Before and after each major change we will perform a series of standardized tests on a virtual machine hosted in my home lab.
- First is to fix the glaring errors found in the code review.
- Review the system calls with DTrace and review application overhead.
- Identify the MIME-Type errors I seem to be getting in debug mode and address them
- Next is to check the
HTTPresponses and ensure they meet the standards ofHTTP/1.0as early tests withheyshow errors. - Change from forking to POSIX standard poll
- Change from
polltoepoll/kqueuefor the applicable systems. - Develop a simple parser to read a config file rather than use command line arguments.
- Create memory arenas to reduce calls to malloc
- replace
writesystem calls with sendfile - and if I’m feeling extra frisky, learn to create a proper
HTTP/1.0parser to more efficiently understand requests
In using Claude Code as a tutor I have worked with it to create a CLAUDE.md file specific to the goal of tutoring me as I revise this project. It’s been instructed not to write the code for me, nor to provide direct solutions, only to point out mistakes that I’ve made. For each of the various stages Claude Code is to ask me test questions which I must complete before it will permit me to work on the next stage.
How the Simple_Server Currently Works…and what’s wrong with it…
To review the source code of the simple_server at the start of this project, please click here. Links to the revised code can be found lower on the page.
Web Servers
Superficially, a web server is simply an application that receives a message from a client through a process’s interprocess communication mechanisms, in this case a Unix socket, parses the message and performs some actions based upon the data within, and returns a message upon completion. This message can be the static text data of an HTML or JavaScript file, or dynamically generated by the server. In the case of an HTTP server, dynamically generated messages are done through the Common Gateway Interface, which allows the secondary application binary files to produce and return dynamically generated content to the server, which is then returned to the client. While CGI is considered outdated compared to modern tools for generating dynamic content, it was still very useful for practicing and learning more about interprocess communication.
The message sent from the client and received by the server must follow the Hypertext Transfer Protocol or HTTP Protocol1. A client sends a request message which contains a method specification inside the message headers. In the case of a GET method, the client is asking for specific data to be returned, usually a file of some type. Another common method is a POST request, in which the client wishes to send specific data to the server in order for the server to perform some action with it. For the HTTP/1.0 standard, the following methods were defined: GET, HEAD, POST, PUT, DELETE, LINK, and UNLINK, though only GET and HEAD were universally expected2. For this simple_server project, only GET and POST methods were implemented.
Upon processing this request the server will return to the client a response message. Inside the response message will be the status of the request, with 400-level responses indicating client errors, 500-level responses indicating server errors, and 200-level responses indicating success. The headers of the response will provide metadata to the client indicating what type of data returned by specifying the MIME Type of the data, the content length, and more. Finally the response body contains the actual data requested by the client.
Using the curl tool in the terminal, we can see the response body sent from the server:
 1jholloway ❯ curl -vs http://localhost:8080/
 2* Host localhost:8080 was resolved.
 3* IPv6: ::1
 4* IPv4: 127.0.0.1
 5*   Trying [::1]:8080...
 6* Established connection to localhost (::1 port 8080) from ::1 port 60244
 7* using HTTP/1.x
 8> GET / HTTP/1.1
 9> Host: localhost:8080
10> User-Agent: curl/8.17.0
11> Accept: */*
12>
13* Request completely sent off
14* HTTP 1.0, assume close after body
15< HTTP/1.0 200 Ok
16< Content-Type: text/html
17< Connection: close
18<
19<html>
20<body>
21<h1>Hello World!</h1>
22<p>This page has been served to you by the simple server</p>
23</body>
24</html>
25* shutting down connection #0
An important aspect of the HTTP protocol is that the messages are stateless, meaning that the behavior of the server does not change after completing a request. A request is sent, processed and response is returned, and then the server returns to waiting for another request as if nothing had happened.
HTTP messages require an underlying transport protocol to establish how the client and the host talk to one another. The two common methods are the Transmission Control Protocol or TCP, which relies on a three-way handshake to ensure that packets are received and a confirmation of reception is returned, as well as User Datagram Protocol or UDP which does not have the reliability and confirmation of a TCP connection, but can be useful when data loss is acceptable. For this project, the TCP protocol was used to connect with clients.
The transport protocol requires a communication layer on which to travel, often Internet Protocol Version 4 or Internet Protocol Version 6. The communication layer is the standard through which information travels on the internet. It handles addressing, routing, and data encapsulation among other things. These protocols are responsible for much of how machines on the internet communicate. The simple web server is capable of communicating over both IPv4 and IPv6.
Process Architecture Summary
Let’s walk through the architecture of the simple_server.
The main function is responsible for initializing the server. It parses the command line flags, sets up signal handlers, creates an IPv4 and IPv6 socket, and finally enters a event loop listening on the two sockets for communication. Upon receiving and accepting the request, the server forks creating a copy of itself with the parent returning to the event loop. The child process parses the request, validates the route of the request and then generates the response including the text body/file content. Whenever a response is generated, the server has to provide the MIME-Type of the file being returned. For this I used the libmagic library, which was able to look up in a database the type of each file and return it as a string. The server then returns this response to the client over the socket and then closes the connect and the child process. By forking each HTTP request gets its own dedicated process, however it comes at a greater system overhead as it requires a syscall to create a new process.
In the event of dynamic content generation the client requests a .cgi file in its request header. The server forks again and calls the exec() function to begin executing the CGI script. This time a pipe is created to allow for bi-directional communication between the CGI child process and the initial child process handling the request, Again, this fork adds to the system overhead. The parameters of a POST request are passed to the CGI process by setting an environment variable. The parent reads the stdout of the script through the pipe and writes it to the body of the response message.
Finally after returning the response to the client the child process handing the request cleans up the file descriptors and the memory allocated before exiting.
Process Communication Diagram 3
 1Legend:
 2  ───▶  control / call flow
 3  ===▶  data flow (messages)
 4  { }   data payload
 5
 6                               {HTTP Request bytes}
 7Client ===============================================================▶
 8
 9                      ┌─────────────────────────────────────────────┐
10                      │                 (Main Server)               │
11                      │                 Parent Process              │
12                      └───────────────┬─────────────────────────────┘
13                                      │
14                              ┌───────▼────────┐
15                              │ select()       │   (watch IPv4+IPv6)
16                              └───────┬────────┘
17                                      │
18                    ┌─────────────────┴──────────────────┐
19                    │                                    │
20               ┌────▼─────┐                        ┌─────▼─────┐
21               │ IPv4     │                        │ IPv6      │
22               │ listen fd│                        │ listen fd │
23               └────┬─────┘                        └─────┬─────┘
24                    │ accept()                           │ accept()
25                    │                                    │
26          {new client socket fd}                 {new client socket fd}
27                    │                                      │
28                    ├─────────────── fork() ───────────────┤
29                    │                                      │
30        ┌───────────▼───────────┐              ┌───────────▼───────────┐
31        │ (Child Process)       │              │ (Child Process)       │
32        │ Connection N handler  │              │ Connection M handler  │
33        └───────────┬───────────┘              └───────────┬───────────┘
34                    │                                      │
35                    │                           (same pattern as IPv4)
36                    │
37                    │
38                    │  Child owns the client socket fd and
39                    │  is responsible for writing the response.
40                    │
41        ┌───────────▼──────────────────────────────────────────────┐
42        │ read() request from client socket fd                     │
43        │ parse request + route (static vs CGI)                    │
44        └───────────┬──────────────────────────────────────────────┘
45                    │
46     ┌──────────────┴─────────────────────────────┐
47     │                                            │
48     │ STATIC FILE PATH                            │ CGI PATH (if enabled + CGI request)
49     │                                            │
50┌────▼─────┐                               (before CGI fork: create pipe #2)
51│ open()/  │                               (child sets env vars for CGI, e.g. REQUEST_*)
52│ read()   │                                            │
53└────┬─────┘                                            │
54     │ {file bytes}                                     │
55     │                                                  │
56┌────▼───────────────────────────────┐          ┌───────▼────────┐
57│ build HTTP response                 │          │ fork() (CGI)   │
58│ {status line + headers + body}      │          └───────┬────────┘
59└────┬───────────────────────────────┘                  │
60     │                                                   │
61     │                                     ┌─────────────▼──────────────────┐
62     │                                     │        (CGI-bin Process)       │
63     │                                     │ reads ENV for request context  │
64     │                                     │ writes dynamic output to stdout│
65     │                                     └─────────────┬──────────────────┘
66     │                                                   │
67     │                         {dynamic output bytes} ===▶ pipe #2 ===▶
68     │                                                   │
69     │                                     ┌─────────────▼──────────────────┐
70     │                                     │ (Child Process, Connection N)  │
71     │                                     │ reads CGI output from pipe #2  │
72     │                                     │ wraps into HTTP response       │
73     │                                     └─────────────┬──────────────────┘
74     │                                                   │
75     └───────────────────────────────────────────────────┴───────────────┐
76                                                                         │
77                                   {HTTP Response bytes} ===▶ write()   |
78                                                                         │
79Client <=================================================================
80
81                      ┌─────────────────────────────────────────────┐
82                      │ NOTE: Parent does NOT relay response bytes. │
83                      │ It returns to select() immediately          │
84                      │ and continues accepting more connections.   │
85                      └─────────────────────────────────────────────┘
The Problems with the Server
Aside from the errors found in the aforementioned Claude Code review, there are larger structural problems with the simple_server application.
One if the issues with the server is that it does not properly implement parts of the HTTP/1.0 specification, and this effects how a client will interact with it. In HTTP a client needs a reliable way to know when a response body ends. Often this is done in the HTTP header by specifying the Content-Length. Without the the Content-Length the client does not know if the server has disconnected intentionally - as in the case of the HTTP/1.0 simple_server - or if there was an interrupt in the communication betweeen the client and the server.
This issue becomes more apparent when using modern clients and tooling, which often follow at minimum the HTTP/1.1 protocol that stipulates a connection must be kept alive after a response is sent. If the client is unaware of the message length and the connection closes, the client may wait for a set period of time for more data to come in. This wait period causes the client to block and can introduce latency into the connection. The increase latency may not be terrible on for an individual client, it can cause issues when performance testing. The testing suite will often give inaccurate results as it spends some of its time waiting for the response timeout rather than sending another test request.
Unfortunately the simple_server does not include Content-Length in its response headers. If we look at the curl output above, we can see that response is missing this information.
To see how this effects performance under concurrent we can perform a test using the hey benchmarking tool. In this example I have run the hey test for thirty seconds (-z 30s) with eight concurrent workers (-c 8) targeting a static file.
1jholloway ~ via v24.12.0
2 ❯ hey -z 30s -c 8 http://127.0.0.1:8080/index.html
3
4Summary:
5 Total: 30.0256 secs
6 Slowest: 0.0594 secs
7 Fastest: 0.0281 secs
8 Average: 0.0375 secs
9 Requests/sec: 212.9518
10
11
12Response time histogram:
13 0.028 [1] |
14 0.031 [57] |■
15 0.034 [1911] |■■■■■■■■■■■■■■■■■■■■■■■■■■■■■■■■■■■■■■■■
16 0.037 [1911] |■■■■■■■■■■■■■■■■■■■■■■■■■■■■■■■■■■■■■■■■
17 0.041 [884] |■■■■■■■■■■■■■■■■■■■
18 0.044 [831] |■■■■■■■■■■■■■■■■■
19 0.047 [550] |■■■■■■■■■■■■
20 0.050 [141] |■■■
21 0.053 [68] |■
22 0.056 [35] |■
23 0.059 [5] |
24
25
26Latency distribution:
27 10% in 0.0328 secs
28 25% in 0.0340 secs
29 50% in 0.0359 secs
30 75% in 0.0407 secs
31 90% in 0.0444 secs
32 95% in 0.0461 secs
33 99% in 0.0514 secs
34
35Details (average, fastest, slowest):
36 DNS+dialup: 0.0001 secs, 0.0281 secs, 0.0594 secs
37 DNS-lookup: 0.0000 secs, 0.0000 secs, 0.0000 secs
38 req write: 0.0000 secs, 0.0000 secs, 0.0003 secs
39 resp wait: 0.0373 secs, 0.0279 secs, 0.0590 secs
40 resp read: 0.0001 secs, 0.0000 secs, 0.0004 secs
41
42Status code distribution:
43 [200] 6394 responses
If we run the same command, but with the -disable-keepalive flag the client will not try to reuse the connect. This avoids the benchmark tool waiting on on a persistant connection until it times out as it does not have a way of measuring the length of the message expected.
1 ❯ hey -z 30s -c 8 -disable-keepalive http://127.0.0.1:8080/index.html
2
3Summary:
4 Total: 30.0286 secs
5 Slowest: 0.0481 secs
6 Fastest: 0.0278 secs
7 Average: 0.0348 secs
8 Requests/sec: 229.4477
9
10
11Response time histogram:
12 0.028 [1] |
13 0.030 [192] |■■■■
14 0.032 [1359] |■■■■■■■■■■■■■■■■■■■■■■■■■
15 0.034 [2138] |■■■■■■■■■■■■■■■■■■■■■■■■■■■■■■■■■■■■■■■■
16 0.036 [1127] |■■■■■■■■■■■■■■■■■■■■■
17 0.038 [490] |■■■■■■■■■
18 0.040 [551] |■■■■■■■■■■
19 0.042 [528] |■■■■■■■■■■
20 0.044 [379] |■■■■■■■
21 0.046 [117] |■■
22 0.048 [8] |
23
24
25Latency distribution:
26 10% in 0.0309 secs
27 25% in 0.0320 secs
28 50% in 0.0336 secs
29 75% in 0.0373 secs
30 90% in 0.0412 secs
31 95% in 0.0427 secs
32 99% in 0.0446 secs
33
34Details (average, fastest, slowest):
35 DNS+dialup: 0.0001 secs, 0.0278 secs, 0.0481 secs
36 DNS-lookup: 0.0000 secs, 0.0000 secs, 0.0000 secs
37 req write: 0.0000 secs, 0.0000 secs, 0.0001 secs
38 resp wait: 0.0346 secs, 0.0276 secs, 0.0478 secs
39 resp read: 0.0001 secs, 0.0000 secs, 0.0003 secs
40
41Status code distribution:
42 [200] 6890 responses
Not only does the above test show an increase in throughput, with roughly ten percent more messages received from the server, but the latency for messages has also decreased sharply.
However, this performance is not great. For comparison, we can use hey on a production ready server like Nginx. Is this fair? Nope!! But it’s fun
First lets see what the Nginx server is sending the client:
1
2jholloway ~ via v24.12.0
3 ❯ curl -vs http://localhost:80
4* Host localhost:80 was resolved.
5* IPv6: ::1
6* IPv4: 127.0.0.1
7* Trying [::1]:80...
8* connect to ::1 port 80 from ::1 port 40615 failed: Connection refused
9* Trying 127.0.0.1:80...
10* Established connection to localhost (127.0.0.1 port 80) from 127.0.0.1 port 29573
11* using HTTP/1.x
12> GET / HTTP/1.1
13> Host: localhost
14> User-Agent: curl/8.17.0
15> Accept: */*
16>
17* Request completely sent off
18< HTTP/1.1 200 OK
19< Server: nginx/1.28.0
20< Date: Wed, 14 Jan 2026 04:21:21 GMT
21< Content-Type: text/html
22< Content-Length: 137
23< Last-Modified: Wed, 14 Jan 2026 04:21:09 GMT
24< Connection: keep-alive
25< ETag: "696719b5-89"
26< Accept-Ranges: bytes
27<
28<html>
29 <body>
30 <h1>Hello World!</h1>
31 <p>This page has been served to you by the simple server</p>
32 </body>
33</html>
34* Connection #0 to host localhost:80 left intact
You can see there is more information in the response header, unsuprising since it is a production ready application using the HTTP/1.1 protocol. However, it does contain the conent length while simple_server does not. Now lets try another test with hey.
❯ hey -z 30s -c 8 http://127.0.0.1:80/index.html
Summary:
Total: 30.0003 secs
Slowest: 0.0024 secs
Fastest: 0.0000 secs
Average: 0.0002 secs
Requests/sec: 107161.7462
Total data: 440439656 bytes
Size/request: 440 bytes
Response time histogram:
0.000 [1] |
0.000 [999707] |■■■■■■■■■■■■■■■■■■■■■■■■■■■■■■■■■■■■■■■■
0.001 [243] |
0.001 [12] |
0.001 [12] |
0.001 [3] |
0.001 [7] |
0.002 [6] |
0.002 [5] |
0.002 [2] |
0.002 [2] |
Latency distribution:
10% in 0.0001 secs
25% in 0.0001 secs
50% in 0.0001 secs
75% in 0.0001 secs
90% in 0.0001 secs
95% in 0.0001 secs
99% in 0.0001 secs
Details (average, fastest, slowest):
DNS+dialup: 0.0000 secs, 0.0000 secs, 0.0024 secs
DNS-lookup: 0.0000 secs, 0.0000 secs, 0.0000 secs
req write: 0.0000 secs, 0.0000 secs, 0.0003 secs
resp wait: 0.0002 secs, 0.0000 secs, 0.0023 secs
resp read: 0.0000 secs, 0.0000 secs, 0.0005 secs
Status code distribution:
[200] 1000000 responses
Wowzers! Look at how many responses it sent out!!
But the crazy thing is the one million responses hey counted wasnt the limit of the server, but of the client. We can see from the report Hey is able to make 107161.7462 requests per second that the Nginx server. This means that over a thirty second period the server was probably able to send more responses, but there was likely a cap on how many responses the hey can analyse. To find the true max, we can test using a different benchmarkig tool, wrk
We will tell wrk to run for thirty seconds with eight runners, but this time the tool will not be capped like hey was:
1 ❯ wrk -t8 -c8 -d30s http://127.0.0.1:80/index.html
2Running 30s test @ http://127.0.0.1:80/index.html
3 8 threads and 8 connections
4 Thread Stats Avg Stdev Max +/- Stdev
5 Latency 63.09us 29.42us 3.46ms 99.78%
6 Req/Sec 15.88k 0.94k 17.84k 62.25%
7 3804452 requests in 30.10s, 1.33GB read
8Requests/sec: 126394.93
9Transfer/sec: 45.08MB
Nginx returned over three million, eight hundred thousand responses in that time period4. This beats my simple_server, with its 6890 responses in thirty seconds, by a factor of 552!
Troubleshooting Bottlenecks with DTrace and Claude
A rate of ~220 responses per second is not good for a server, even one written in ones sparetime as a learning experiment. Lets see if we can find out where the bottlenecks are.
Since I’m a regular listener of the podcast Oxide and Friends I’m regularly bombarded with talks about DTrace, the dynamic tracing tool5. DTrace is a dynamic tracing framework that lets you observe what the system and application are doing whil they run. This is done by enabling probelsm that fire on events such as system calls, file opens, network I/O, and more. Since I already know that the fork-on-connection model used by the simple_server is expensive, DTrace seems like a good tool for measuring how often a fork occurs and for how long, or if the bottleneck is somewhere else.
Since I am new to DTrace, but knew what I wanted it to do I felt that this would be a good usecase for a LLM. In keeping with the ideas in Steve Klabnik’s blog post I had Claude Code write up several DTrace scripts as I looked into this problem:
- A script to identify which syscalls were being called by the
simple_serverand for how long - A script to tell us review blocking I/0 operations and see which ones halting the operation of the server
- A script to identify whether the blocking operating was in code I had written or in code used in a a library function.
After DTrace ran each script observed the server perform the same thirty second HTTP benchmark tests as seen above, the DTrace output was saved to a text file for Claude Code to read. Claude was instructed to read the DTrace output and to try to look through the codebase to see where the issues were occuring. We would then use what it found, along with some probing question, to determine the next script and repeated this pattern until we identified the bottlenecks.
Thinking that the issue was the fork system call used to handle each connection, the first DTrace script was written to track which syscalls were made and how long the application spent in total. I was shocked to see from the DTrace output that the taking up most of the server’s time was read, followed closely by fstat and fstatat.
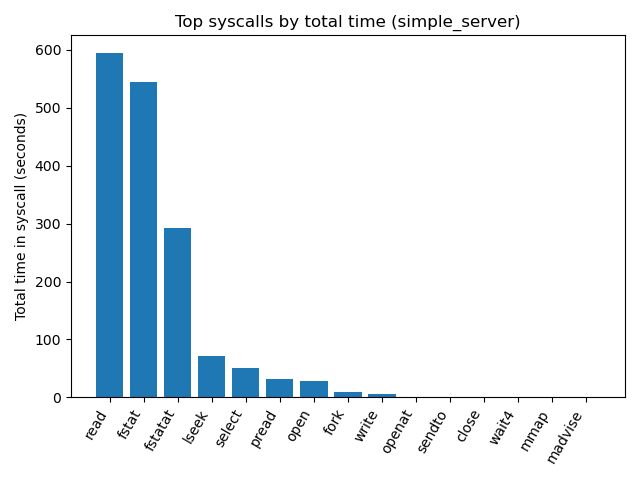
The chart shows the cumulative CPU time for the different syscalls. The cumulative CPU time referrs to the CPU time for each of the simple_server child processes running concurrently during the thirty second test added together. With thousands of child processes over the thirty second test, the small amounts of time spent inside of a syscall can cumulatively add to hundreds of seconds.
The read syscall is responsible for reading from a file descriptor, such as a socket or a file, so it makes sense for this syscall to be called often. However, the ~600 seconds spent reading while dealing with small HTTP requests and small files lead me to thinking there was something else going on with read(). The other major syscalls fstat and fstatat cumulatively take up the most time at roughly 900 cumulative CPU seconds. These two syscalls are responsible for looking up the meta-data of a file; this was likely related to the way in which I was getting the MIME-Type.
Another syscall that was called more often that expected was lseek. Why was the server seeking so often in files? Most of the data read was either a file from is beginning to end, or buffered IO coming from a socket.
Knowing now that it was IO operatings and not process forking that was the major slowdown, I worked with Claude Code to create a new DTrace script to analyze IO. The same test was run on the server while DTrace observed and recording IO operations. Being new to reading DTrace results and performance benchmarking, I asked Claude Code to review the results and the simple_server code base to come up with hypothesis as to why the bottlenecks were occuring.
 1## Key Statistics
 2
 3| Operation | Count | Avg Latency | Min | Max | Total Impact |
 4|-----------|-------|-------------|-----|-----|--------------|
 5| **read** | 7,603 | **58.9ms** | 1ms | 528ms | **Massive bottleneck** |
 6| **fstat** | 2,988 | **107.8ms** | 1ms | 553ms | **Worst offender** |
 7| **fstatat** | 2,900 | **88.0ms** | 1ms | 484ms | **Second worst** |
 8| **write** | 26 | ~1ms | - | - | Negligible |
 9
10---
11
12## Shocking Discoveries
13
14### 1. Catastrophically Slow fstat() Calls
15- **Average fstat latency: 107.8ms** (should be ~0.01ms)
16- **That's 10,000x slower than expected!**
17- Some fstat calls taking over **½ second** (553ms)
18
19### 2. Massive File I/O Overhead
20- **Average read latency: 58.9ms** (should be ~0.1ms)
21- **590x slower than expected**
22- Some reads taking over **½ second** (528ms)
23
24### 3. Read Pattern Analysis
25
26114 bytes:    3,803 reads  (50% of all reads)
27131,072 bytes: 2,309 reads  (30% of all reads)
281,245 bytes:   1,152 reads  (15% of all reads)
29
30**What this means:**
31- **114-byte reads**: Likely HTTP request headers from socket
32- **131,072-byte reads**: Large file chunks (131KB = your buffer size?)
33- **1,245-byte reads**: Small file chunks or magic library reads
It found one of the likely culprets, libmagic calling fstat to get the MIME-Types, but something else was still performing a lot of blocking I/O.
I told Claude Code to write a third DTrace script, this time to find out what files are being read by the server so that we can see where the I/O error was occuring. Once again, the output from DTrace was piped into a file for Claude to read and analyze.
Click Here for Claude Code Analysis of DTrace Output
1# DTrace File Analysis Results
2
3## What This Data Reveals
4
5The file analysis DTrace script encountered significant issues but **still captured crucial performance data**. Here's what it means:
6
7---
8
9## Critical Findings
10
11### 1. Magic Library is the Killer (The Smoking Gun)
12
13File: /usr/share/misc/magic.mgc
14 Time: 2,140,743,761 ns (2.14 seconds!)
15 Bytes: 10,164,066 (10MB read)
16 Calls: 197 (197 separate reads)
17
18
19**This is devastating evidence:**
20- **Magic library consuming 2.14 seconds** of total I/O time
21- **10MB of magic database reads** for MIME type detection
22- **197 separate read operations** to the magic file
23- This explains your `fstatat` performance problems!
24
25### 2. Timezone File Overhead
26
27File: /etc/localtime
28 Time: 11,974,803,116 ns (12 seconds!)
29 Bytes: 70,211,300 (70MB read)
30 Calls: 8,183 (8,183 reads!)
31
32File: Etc/UTC
33 Time: 45,575,225,834 ns (45.6 seconds!)
34 Bytes: 1,219,578,496 (1.2GB read!)
35 Calls: 13,975 (14,000 reads!)
36
37
38**Why timezone files?**
39- Your server logs include timestamps: `handleConnection.c:29-32`
40- `gmtime()` and `strftime()` calls trigger timezone file reads
41- **Every HTTP request** triggers timezone file access for logging
42- **45.6 seconds** spent just reading timezone data!
43
44---
45
46## Performance Impact Breakdown
47
48| File Category | Time (seconds) | Purpose | Impact |
49|---------------|----------------|---------|---------|
50| **Timezone files** | 57.5s | Timestamp generation for logs | **MASSIVE** |
51| **Magic database** | 2.1s | MIME type detection | **HIGH** |
52| **Unknown files** | 299s | Unknown (script errors) | **UNKNOWN** |
53
54**Total identified I/O time: ~359 seconds for the test period**
55
56---
57
58## Root Cause Analysis
59
60### Problem 1: Logging Timestamp Overhead
61Every HTTP request executes this code:
62
63// handleConnection.c:29-32
64current_time = time(NULL);
65utc_time = gmtime(¤t_time); // Reads timezone files!
66char timestamp[21];
67strftime(timestamp, sizeof(timestamp), "%Y-%m-%dT%H:%M:%SZ", utc_time);
68
69
70**With 10,000+ requests:**
71- Each `gmtime()` call reads `/etc/localtime` and `/etc/timezone`
72- No caching between processes (each fork reads separately)
73- **8,183 + 13,975 = 22,158 timezone file reads**
74- **57.5 seconds** wasted on timestamp generation alone!
75
76### Problem 2: Magic Library Database Reads
77// parseRequest.c:148
78magic_t magic = magic_open(MAGIC_MIME_TYPE);
79// parseRequest.c:151
80magic_load(magic, NULL); // Reads 10MB magic database!
81// parseRequest.c:158
82const char *file_type = magic_descriptor(magic, file_des);
83
84
85**Every static file request:**
86- Reads the entire magic database (`/usr/share/misc/magic.mgc`)
87- 10MB read **per request** (no caching)
88- **197 requests × 10MB = 2GB** of magic database reads
89
90---
In the analysis Claude Code was able to review the file system I/0 and identify two large sources of overhead: the file /usr/share/misc/magic.mgc and /etc/localtime were both being read repeatedly by forked request handler.
The file magic.mgc is a database file used by libmagic and contains the MIME-Types and other information on different types of fils. Typically for a database object like this you want to load it into the main body loop so that it is only loaded once as it is a 10 MB file. From there you would pass a pointer to the file to other functions so that they can have access to the data without having to reload it in their stackframe. Rather than doing this, simple_server was loading the file magic.mgc in the whenever the function parseRequest() was called. Not only was it being loaded whenever this function was being called, but this 10 MB file was being loaded by every child process created to handle a request. This resulted in a huge amount of I/0 overhead!
The solution to this major problem was to move the initialization and loading of of the magic.mgc library from the function parseRequest(), and instead set it up at the beginning of the main function and passing a pointer to the child functions. Now the largest I/O bottle neck on the server has been reduced from occuring every fork() to once during the entire run time of the server.
The second file regularly being read was /etc/localtime. Claude read through my code base and found a mistake I had made.
As part of the assignment requirements, the server has to have command line arguments telling it to log request with a timestamp to a text file or to the terminal in debug mode. When it does it this it has to call the functions gmtime and strftime to get the local. Unfortunately, the way in which the code was written meant that these function calls were being made regardless of whether or not the server was in log/debugging mode, adding to the extra I/O overhead.
1
2void handleConnection(int fd, union sockaddr_union *client,
3 enum sockType sockType) {
4 const char *rip;
5 char claddr[INET6_ADDRSTRLEN];
6 int bytes_sent = 0;
7 int rval;
8 int resp_status;
9 time_t current_time;
10 struct tm *utc_time;
11
12 current_time = time(NULL);
13 utc_time = gmtime(¤t_time);
14 char timestamp[21];
15 strftime(timestamp, sizeof(timestamp), "%Y-%m-%dT%H:%M:%SZ", utc_time);
16
17 // ... unrelated setup / request parsing omitted ...
18
19 if (app_flags & D_FLAG){
20 fprintf(stdout, "%s %s \"%s\" %d %d\n", rip, timestamp, req_token,
21 resp_status, bytes_sent);
22 }
23
24 if(app_flags & L_FLAG){
25 FILE *log_ptr = fopen(log_addr, "a");
26 if (log_ptr == NULL) {
27 perror("Unable to create logfile: ");
28 exit(EXIT_FAILURE);
29 }
30 fprintf(log_ptr, "%s %s \"%s\" %d %d\n", rip, timestamp, req_token,
31 resp_status, bytes_sent);
32
33
34 fclose(log_ptr);
35 }
36
37// ... (rest of function omitted)
Adding a simple if-statement around the time functions was a quick way to reduce file system I/O.
1if ((app_flags & D_FLAG) || (app_flags & L_FLAG)){
2 current_time = time(NULL);
3 utc_time = gmtime(¤t_time);
4 char timestamp[21];
5 strftime(timestamp, sizeof(timestamp), "%Y-%m-%dT%H:%M:%SZ", utc_time);
6}
The server is loading and searching through the magic.mgc database every time it is checking the MIME-Type of a file. The value from the
1// parseRequest.c
2    const char *file_type = magic_descriptor(magic, file_des);
3
4    char *header_buf = (char *)malloc(HEADER_BUF_SIZE);
5
6    snprintf(header_buf, HEADER_BUF_SIZE,
7             "HTTP/1.0 200 Ok\r\nContent-Type: %s\r\nConnection: close\r\n\r\n",
8             file_type);
Rather than call the magic_descriptor function and reading through the database for each file served we can instead use a static lookup to parse the URI and return the MIME-Type. If the MIME-Type cannot be found from the URI only then is the magic_descriptor function is called and the library file read. The following function has been added to the file parseRequest.c:
 1
 2const char* get_mime_type_by_ext(const char* filename, magic_t magic, int file_des){
 3    const char* ext = strrchr(filename, '.');
 4     if (!ext) {
 5         return magic_descriptor(magic, file_des);
 6     }
 7
 8          // Wowzers a lookup table!
 9          if (strcasecmp(ext, ".htm") == 0)   return "text/html";
10          if (strcasecmp(ext, ".txt") == 0)   return "text/plain; charset=utf-8";
11          if (strcasecmp(ext, ".csv") == 0)   return "text/csv; charset=utf-8";
12          if (strcasecmp(ext, ".md") == 0)    return "text/markdown; charset=utf-8";
13
14          // ... other return types omitted for brevity
15          return magic_descriptor(magic, file_des);
16     }
parseRequest.c will now call this function and use the string returned for creating the response header. With this change the overhead to create a response is dramatically reduced, improving the overall performance of the server.
1 ❯ hey -z 30s -c 8 -disable-keepalive http://127.0.0.1:8080/index.html
2
3Summary:
4 Total: 30.0019 secs
5 Slowest: 0.5357 secs
6 Fastest: 0.0009 secs
7 Average: 0.0033 secs
8 Requests/sec: 2450.6440
9
10
11Response time histogram:
12 0.001 [1] |
13 0.054 [73315] |■■■■■■■■■■■■■■■■■■■■■■■■■■■■■■■■■■■■■■■■
14 0.108 [0] |
15 0.161 [0] |
16 0.215 [0] |
17 0.268 [0] |
18 0.322 [0] |
19 0.375 [0] |
20 0.429 [0] |
21 0.482 [0] |
22 0.536 [208] |
23
24
25Latency distribution:
26 10% in 0.0016 secs
27 25% in 0.0017 secs
28 50% in 0.0018 secs
29 75% in 0.0019 secs
30 90% in 0.0019 secs
31 95% in 0.0020 secs
32 99% in 0.0021 secs
33
34Details (average, fastest, slowest):
35 DNS+dialup: 0.0000 secs, 0.0009 secs, 0.5357 secs
36 DNS-lookup: 0.0000 secs, 0.0000 secs, 0.0000 secs
37 req write: 0.0000 secs, 0.0000 secs, 0.0004 secs
38 resp wait: 0.0032 secs, 0.0007 secs, 0.5356 secs
39 resp read: 0.0000 secs, 0.0000 secs, 0.0002 secs
40
41Status code distribution:
42 [200] 73524 responses
Compared to the earlier hey benchmark with the same flags, that is a 10.7X improvement in requests handled. Still far slower than nginx, but a vast improvement none the less!
Let’s run the DTrace script again to observe how much time the simple_server spends in which syscalls.
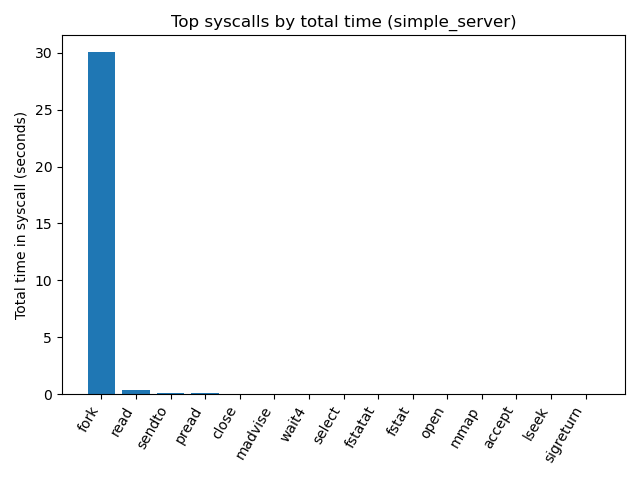
There is a dramatic reduction in file system I/O. fstat is reduced from 543.9 seconds to 0.03 seconds and fstatat from 292.2 seconds down to 0.03. The time spent performing the open syscall has been reduced from 27.5 seconds to 0.03 seconds, and read has changed from 595.4 down to 0.4 seconds. We can see now that the simple_server is spending most of its active processing time in the fork syscall, and the DTrace report shows the select syscall now has a higher cumulative time as it waits for connections.
The aforementioned changes can be seen in the updated branch of the source code found here.
Conclusion - What’s next?
With these updates, I’ve completed what I consider Phase 0 of this project, getting it ready for further iteration while working with Claude Code. Learning more about utilizing dynamic tracing was very exciting and resulted in more than 10X improvement for the server. Following Steve Klabnik’s advice of using LLMs as partners for learning has reduced my concerns about pursuing Computer Science in an age of AI tooling. I am happy that Claude Code was able to assist me in using DTrace to perform benchmarking tests and identify performance bottlenecks in the simple_server, in addition to coding errors, potential security issues, and even spelling & grammatical errors for this blog post!
The next phase of this project really excites me: replacing the fork system call with the more efficient poll syscall, before then implementing FreeBSD’s kqueue. I’ve always wanted to learn more about concurrent programming and implementing features that take advantage of what modern operating systems have to offer.
Until then, you can see the final results of Phase 0, including all of my refactoring and fixing the security and other issues identified by Claude Code in the repo’s phase_0-COMPLETE branch.
-
“
HTTPProtocol” is a silly term when you think about it as the P in the initialism already contains the word protocol. It’s similar to how the “D.C” in D.C. Comics stands for “Detective Comics” making the full name “Detective Comics Comics”. ↩︎ -
The exact details of the
HTTP/1.0standard can be found in RFC1945. For more information of the differentHTTPstandards the Wikipedia Page has some good information. ↩︎ -
I’d be a liar to say I didn’t use AI to write up this fancy diagram. But I’m terrible at art. ↩︎
-
I got curious and wanted to see how many responses
wrkcould get from the Hugo development server. Sending a copy of the index to this blog it sent just over 5.8 million in thirty seconds! ↩︎ -
For a while DTrace was the centre tile on the bingo cards at https://oxide.bingo since it was a guarantee that they would mention it. ↩︎